When Bitcoin or Ethereum moves, so does social media. Market charts and memes merge into one live classroom of emotion, analysis and reaction, where every scroll feels like a financial commentary.
Each shift in the market sparks the same digital ritual. Bitcoin spikes, Ethereum drops and X (that’s Twitter) instantly transforms into a global trading arena. Feeds overflow with visuals, humour and speculation, turning the platform into a space where excitement, anxiety and curiosity collide in a single stream of information and feeling.
What begins as a market report becomes instantly social. Technical debates unfold among traders, newcomers voice hot takes and communities in far-flung parts of the world respond together. Every surge or correction becomes more than a move in crypto prices today; it’s a moment of shared reaction, reflecting how intertwined finance and conversation have become.
The market moves and so does X
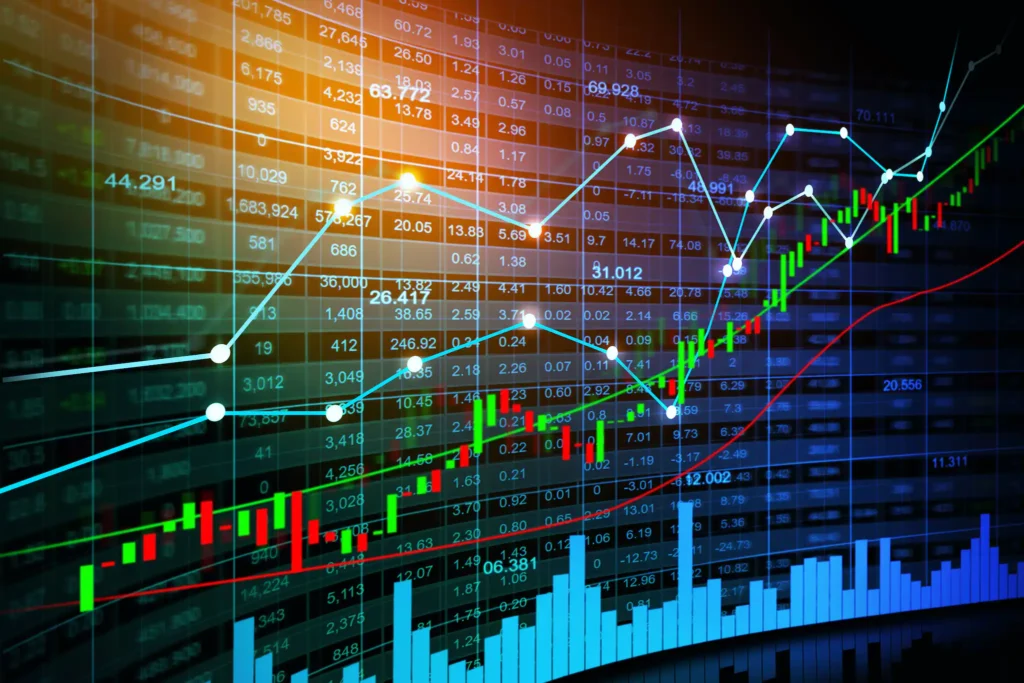
Binance Research says, “The total crypto market cap lost more than US$300B this week, falling to US$3.7T towards the end. Riskier assets like altcoins fell the most, with Ethereum falling over 13% and Solana by 20%. BNB fell only by ~3% while BTC slipped ~6%.”
Those losses triggered intense online discussion. Statistics from tracking analytics like CoinGecko and LunarCrush (October 2025) reveal severe spikes in social activity around Bitcoin and Ethereum after significant market relocations, commonly increasing more than 200% in the midst of deep corrections.
The playbook is all too familiar: volatility erupts, social feeds are filled with discourse and online argument supplants the traditional business reporting.
How every scroll becomes a sentiment index
If you’ve ever looked at X after a big crypto swing, you’ve probably noticed an influx of screenshots, predictions and “told-you-so” charts. Those reactions provide a real-time view into group sentiment.
Binance Research verifies, “The traditional four-year market cycle is nearing the end of the bull run, but this time may differ. Institutional Bitcoin ownership has risen from 0.9% in 2014 to 19.8%, which could mean smaller pullbacks.”
That transfer of ownership may calm wild swings in the long run, but online emotions remain fast and fierce. On X, reactions often surface before charts refresh. To many observers, the feed becomes a vivid display of confidence, doubt or humour shaped by market bias.
From memes to macro
Crypto discussions on X don’t stay technical for long. A dip in Bitcoin turns into a meme and a new token launch becomes a trending topic. Humour cushions volatility while quietly teaching financial literacy.
You might see a chart paired with a punchline, but behind it is an education in real economics. Each meme explains supply and demand, network congestion or liquidity stress in plain sight. For many, that’s how market dynamics are learned, not from textbooks but through timelines.
Key social patterns visible during market swings:
- Bullish rallies flood X with charts and “buy confidence” memes.
- Bearish turns fill timelines with debates about regulation and tech resilience.
- Stable periods spark reflections on long-term adoption or comparisons with traditional assets.
When data turns into culture
Crypto updates are now part of everyday online existence. For example, reports about Solana’s US$1.65 billion ecosystem treasury were widely discussed among all things blockchain communities.
Meanwhile, Ethereum’s roadmap advancements, such as Dencun and proto-sharding, are often enough to ignite threads, jokes and lengthy explainer pieces from the technically savvy and the occasional buyer.
In practice, market updates spawn waves of invention, converting boring numbers into memes, montaged videos or thoughtful analysis. Even non-investors take a peek at price action, attracted by the thrill of collective meaning.
The global classroom of finance
The most remarkable aspect? Geography barely matters. A Nairobi student, a Bangalore coder and a São Paulo freelancer can all view the same chart in moments.
Binance Research highlights how large-scale participation has become global. Its September 2025 market report noted that Ethereum’s share of total crypto markets rose to 14.2%, while Bitcoin’s dominance dipped below 57.3%, signs of a maturing, interconnected ecosystem.
It’s no longer just data; it’s shared experience. When markets move, timelines on X light up. Analysts interpret, newcomers question and memes illustrate the passion behind the numbers, a conversation unfolding across borders in real time.
Considering all this
Volatility in Crypto has increased from market behaviour to a cultural barometer. X obfuscates boundaries between trader and viewer, making each big swing communal. When prices skyrocket or plummet, timelines respond unedited, salty, raw and informative, an online agora where reactions, charts and jokes tell how finance feels.
Binance stats can base the facts, but the interpretation falls with the crowd. Everyone in this medium adds to the shared space and each message, analytical with the analyticals and sentimental with the sentimentals, becomes a new layer in which the world experiences moving money.
Volatility is a language of inclusion and belonging, which unites worldwide voices through screens.